Access Report System
Note: This was quoted over a pervasive ODBC driver using Access, but all the data is the same.
This project will create Access reports from Lytec information. The Pervasive ODBC driver will be configured, so the Access system can import files from the Lytec database. The Access database, and all the queries created, will be given to you so that you can use them to build new reports and queries for your own use. You will be able to select the following reports:
- Procedure Volume report
- Insurance Analysis report
- Referring Doctor Billing report
- Insurance Full Payment report
- Downcoding Analysis report
All reports deal with primary insurance information, not secondary. No insurance will be listed as “SELFPAY”, but their payments will not be reported. They also only analyze the primary diagnosis of each line. The following screen will be used to submit all of the reports, with a different button for each report.
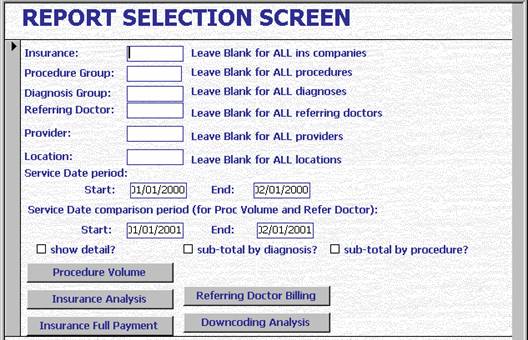
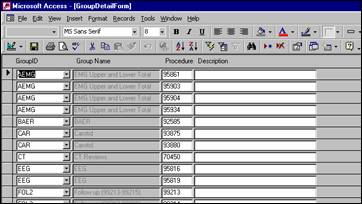
The following screen will be used to group procedures together for reporting purposes. On a report, you can choose one group of procedures, or you can select all groups.
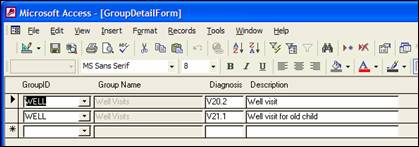
The following screen will be used to group diagnoses together for reporting purposes. On a report, you can choose one group of diagnoses, or you can select all groups.
The reports will have the following information:
Procedure Volume report
You will run this for the following selections:
Insurance (one or all)
Procedure (one group or all)
Diagnosis (one group or all)
Referring doctor (one or all)
Location (one or all)
Provider (one or all)
Service Date Period 1
Service Date Period 2 for comparison
It will sort by insurance, location, procedure and diagnosis
You can choose whether to sub-total by procedure and diagnosis, but the diagnosis cannot be sub-totaled when the procedure is not sub-totaled.
You can select whether to show detail or not.
The report will have the following summary columns:
Insurance Procedure Diag Count in Period 1 Count in Period 2 Difference Diff %
The report will have the following detail, with only one line for each charge, (not a separate line per payment):
Ins: Proc:
Diag:
Bill: Chart: Name: Prov:
Insurance Analysis report
You will run this for the following selections:
Insurance (one or all)
Location (one or all)
Procedure (one group or all)
Diagnosis (one group or all)
Referring doctor (one or all)
Provider (one or all)
Service Date Period 1
It will sort by insurance, procedure and diagnosis.
You can choose whether to sub-total by procedure and diagnosis, but the diagnosis cannot be sub-totaled when the procedure is not sub-totaled.
You can select whether to show detail or not.
The report will have the following summary columns:
Insurance Procedure Diag Avg paid Avg Days
The report will have the following detail, with only one line for each charge, (not a separate line per payment):
Ins: Proc: Diag: Bill: Chart: Name: Prov:
Referring Doctor Billing report
You will run this for the following selections: (You are expected to create a procedure group containing 99244 and 99243 to run this report, so only new patients will be selected.)
Insurance (one or all)
Procedure (one group or all)
Diagnosis (one group or all)
Referring doctor (one or all)
Location (or or all)
Provider (one or all)
Service Date Period 1
Service Date Period 2
It will sort by referring doctor.
It will only sub-total by referring doctor.
You can select whether to show detail or not.
The report will have the following summary columns:
|---------Period 1-----------| |------Period 2-----------|
Referring doctor # New Patients Paid # New Patients Paid Diff Diff%
(Note: I changed from avg paid to paid, since that makes more sense for this report.)
The report will have the following detail, with only one line for each charge, (not a separate line per payment):
Ins: Proc: Diag: Bill: Chart: Name: Prov:
Insurance Full Payment report
This report will just select all procedures that are ever
paid at least 78% of allowed in the time period selected:
You will run this for the following selections:
Insurance (one or all)
Procedure (one group or all)
Diagnosis (one group or all)
Referring doctor (one or all)
Provider (one or all)
Location (or or all)
Service Date Period 1
It will sort by insurance, procedure and diagnosis.
You can select whether to show detail or not.
The report will have the following summary columns:
Insurance Procedure Diagnosis Allowed Allowed – 80% Avg Paid Count
The report will have the following detail, with only one line for each charge, (not a separate line per payment):
Ins: Proc: Diag: Bill: Chart: Name: Prov:
Downcoding Analysis
report
* Change so it shows Insurance / ref dr / loc and whether a bill had only partial or partial plus full.
Select if:
at least one partial payment and more than one payment
OR only one payment and that payment is partial and the amount paid is less than 78% allowed
It is successful if the amount paid by ins is ? 78% of allowed.
It is pending if the total bill is open; otherwise it is closed. (Total > 0 is open. You may need to rebuild data.)
A successful appeal is one that has a full primary insurance payment type as one of the payment. You will run this for the following selections:
Insurance (one or all)
Procedure (one group or all)
Diagnosis (one group or all)
Referring doctor (one or all)
Provider (one or all)
Location (one or all)
Service Date Period 1
It will sort by insurance, procedure and diagnosis.
You can choose whether to sub-total by procedure and diagnosis, but the diagnosis cannot be sub-totaled when the procedure is not sub-totaled.
You can select whether to show detail or not.
An appeal will be considered successful and fully paid if a
full insurance payment code is found for that line.
The report will have the following summary columns:
Insurance Proc Diag Appeal Successful* # of procedures partially paid total # of procedures partial%
(*Appeal is considered successful if a payment is made without the partial check box.)
The report will have the following detail, with only one line for each charge, (not a separate line per payment):
Ins: Proc: Diag: Bill: Chart: Name: Prov: