Access Exercise Day 2: This needs to be turned into Moodle's Access Graded Assignment.
Review of some Access concepts
Database Tables:
Table:
Key field – Unique Identifier ; Will identify the row
Query and Reports:
Import from Excel:
Link to Excel:
1. Last class, you imported your simple inventory list.
- In Access: file / Get external data / import and then change the file type to excel and browse to the file. Double click the file to import it and just accept all defaults with next.
It has the following fields:
Simple List
|
Field |
Type |
Size |
|
Item# |
Number |
Integer |
|
Item |
Text |
255 |
|
Category |
Text |
20 |
|
Quantity |
Number |
Double |
|
Unit Value |
Number |
Double |
|
Total Value |
Number |
Currency |
|
percent of Total Value |
Number |
Currency |
|
More than 1 |
Text |
255 |
|
Sentence about item |
Text |
255 |
2. Work with queries: - Notice how the query is a view on the table and reflects all changes in the table.
List the item #, item, category and quantity of every item that has at least a quantity of 2. Sort by category. Save the query. To do this:
- Click
queries on the left:
- Click
create query in design mode:

- Click Tables tab and "Simple list" or whatever your inventory list is called:
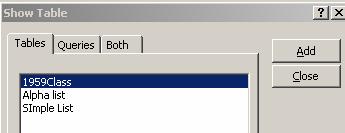
- click close
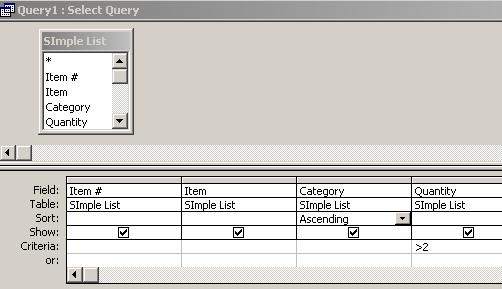
- drag down the item#, item, category and quantity to the columns below. In the criteria row of Quantity, write >2. In the Sort row of category, hit the down arrow and choose Ascending. Your query design will look like this:
- Choose file / save as and name this "many item query".
- Choose view and then databasheet view to see the items that had more than 2.
- File / close
- Click on tables and then double click the inventory table to change the quantity of some items. Also, add one more item.
- File / close
- Click on queries and double click the "many item query" again.
- See that it changed to reflect what you typed.
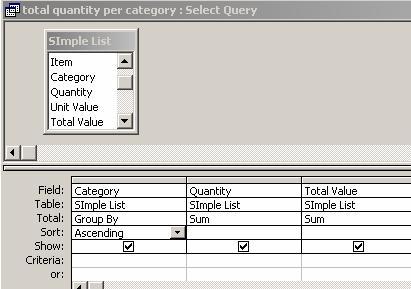
3. Work with a grouping query to get group totals: To get the totals for each category: (Notice how Access can easily get group totals.)
- click query
- click create query in design view
- Click Tables tab and "Simple list" or whatever your inventory list is called
- Click close
- Drag down category, quantity and total value
- Query / crosstab – and now a new total row will show.
- Change total row for quantity and total value to sum
- Query / select query to remove the crosstab row
- View / datasheet view to see the totals per category
- File / save as and name it "total per category"
It will look like this:
4. Add a category table in Excel. The categories should match the categories in your inventory list. The Category table you will create will have: (Notice how you have have 2 tables in Access)
|
Field |
Type |
Size |
|
Category |
Text |
15 |
|
Description |
Text |
100 |
|
Sort Order |
Number |
int |
. You can enter a list of categories in Excel and then import them.
- In Excel, type Category, description and sort across the top
- Fill in every category name that appears in the inventory simple list
- Put some description next to the category name.
- Put any number in the sort column.
- File / save
- In Access: file / Get external data / import and then change the file type to excel and browse to the file. Double click the file to import it and just accept all defaults with next.
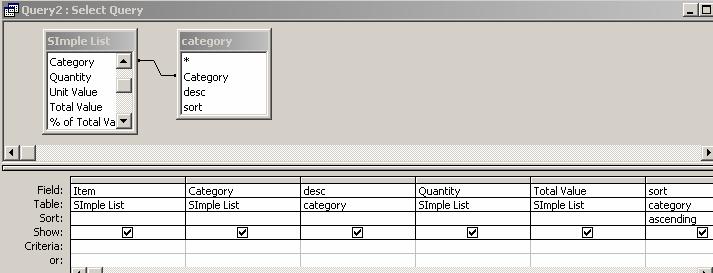
5. Create a query that shows each of your items with the category description.
|
|
Description |
Sort order |

|
Item # |
Item |
Category |
Quantity |
Unit Value |
Total Value |
|
Item # |
Item |
Category |
Quantity |
Unit Value |
Total Value |
|
Item # |
Item |
Category |
Quantity |
Unit Value |
Total Value |
Category ID |
Descr- iption |
|
Item # |
Item |
Category |
Quantity |
Unit Value |
Total Value |
Category ID |
Descr- iption |
- click query
- click create query in design view
- Click Tables tab and "Simple list" or whatever your inventory list is called
- Also click categories. Now you have 2 tables on the top.
- Click close
- Click on categories in one table and draw a line to categories in the other table.
- Drag down item, category, quantity and total value, category name, sort
- On the sort row, choose ascending under the "sort" column
- View / datasheet view to see every item with its category. Note that you only had to type the category name a few times to get it to repeat in your query.
- File / save as item with category query.
This is all you had to do to understand all you need for the final. You now know how to navigate tables and queries in Access. You have imported tables and worked with joining tables together. You see that it can save typing. You see that a query may help you quickly analyze data by groups.
Here is more you can do if you have time:
6. Use the report wizard on the item with category query
- Click report
- Click create report with wizard.
- Choose the item with category query
- Select all fields
- Group on category
- Sum the quantity and total value
- Choose next until it ends.
7. Create a report of all items and show the total value and quantity in each category.
8. Create a form to input Categories
9. Create another form to input more timesheets
10. Enter 2 more inventory items and 2 more categories.
11. Use queries to answer questions:
1) What is the total value of 2 of your categories?
2) What is the highest value category?
3) Which category has the most items?
4) Which category has no items?