Christopher K. Storm
Fun Research Pictures
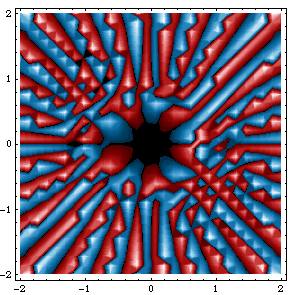
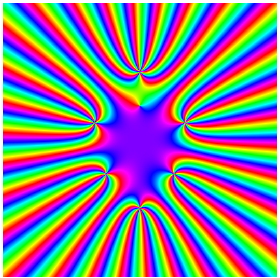
These pictures plot the argument of the inverse of the Ihara-Selberg zeta function of the Petersen graph. The first plot is a contourplot tweaked to allow the colours to differentiate between positive and negative arguments. The second plot is a more traditional "hue" type plot. The colors converge on the zeroes of the polynomial. In both cases, we can see some rather remarkable symmetries apparent in the zeta function.
Special thanks to David Farmer for giving me Mathematica examples of changing the colors in ContourPlot. The red and blue picture is a direct result of his help.
Back to my research